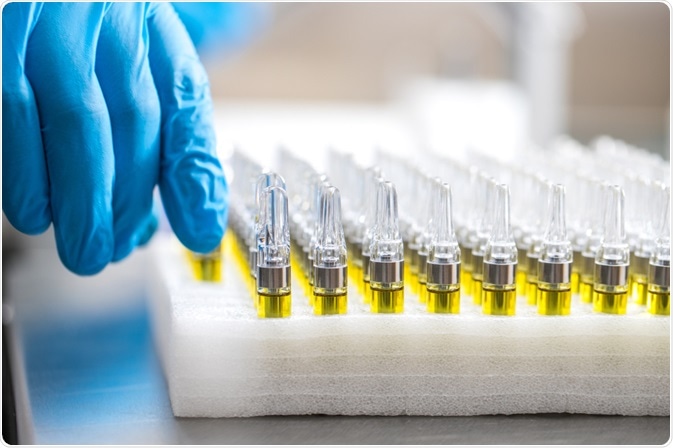
A team from the Texas A&M University have developed a means of performing confirmatory diagnostics of Cannabis Sativa using a portable hand-held Raman spectrometer. This means of diagnosis can distinguish cannabis from its non-psychoactive counterpart, hemp with 100% accuracy.
 Image Credits: 420MediaCo / Shutterstock.com
Further, Raman spectroscopy can interrogate the content of the THCA in the analyzed samples. This tool offers various border and law enforcement employees the ability to quickly, accurately and easily identify the presence and quantity of the psychoactive compound present in plants.
Delta-9-tetrahydrocannabinolic acid (THCA) is the non-psychoactive component of Cannabis Sativa that undergoes oxidation to produce the psychoactive delta-9 tetrahydrocannabinol (THC). Approximately 2.5% of the world’s population consumes cannabis which posits it as the most cultivated and illegally traffic drug worldwide.
As such, border control and law enforcement agencies must perform confirmatory diagnostic at borders. This is commonly performed by high-pressure liquid chromatography (HPLC). While this procedure offers sophistication and accuracy, it has several associated drawbacks; it involves sample destruction, is time-consuming and can only be performed in certified laboratories.
This inconvenience has prompted the development of a portable, non-invasive and non-destructive approach to cannabis diagnosis that can be performed in situ. The most amenable technique that adheres to these requirements is Raman spectroscopy (RS).
Previous tests based on color change were found non-applicable in the context of forensics as they are costly, destructive and quantitative-only. Their inability to quantify THC concentration is particularly problematic, as concentrations of up to 0.3% are permissible in cannabis; and this amount can induce a color change.
The Raman spectroscopy technique is based on the inelastic light scattering of photons; this results in the excitation of sample molecules from a lower to higher vibrational or rotational state. Following this, these photons are collected by the spectrometer for the determination of their change in energy state. As the change in energy is proportional to the sample's vibrational properties,
Raman spectroscopy can be used to query the sample’s structure and composition. As the Raman spectroscopy technique can distinguish between hemp and cannabis with an accuracy of 100%, and provide a quantitative readout of the THC concentration, the Raman spectroscopy based approach is suitable for police use, offering a non-invasive, non-destructive method capable of performance at the point of need.
To develop and test their diagnostic tool, the team used frozen hemp and cannabis samples for interrogation by a handheld Raman spectrometer. The varieties tested are known as “triple chocolate chip (TCC)”, “gelato cake (GC)”, and “twisted sherbert (TS)”. The spectra obtained were compared to a baseline for correction.
The team found that the spectrum obtained was dominated by bands corresponding to carotenoids, lignin, and cellulose, and all varieties contained THCA. This was determined by the presence of four bands on the spectrum, in addition to changes in the intensity of bands at district frequencies in cannabis samples relative to those in hemp.
The latter change in intensities is insufficient for confirmatory diagnostics as they overlap with the bands that indicate the presence of carbohydrates and cellulose. Despite this, they indicate key structural differences between the two. To corroborate the utility of Raman spectroscopy in distinguishing hemp from cannabis, the team performed a data analysis technique, OPLS-DA.
This produced a model plot that identified a peak corresponding to THCA and the plant material cellulose and lignin. In addition, the model identified peaks that correspond to aliphatic chemical structures that originate from THCA. These results supported the conclusions drawn from their spectral analysis. Further, the data analysis employed assigned all 86 spectra, which suggested that the coupling of OPLS-DA and RS enables 100% accuracy when distinguishing hemp from cannabis.
The team then queried the use of RS in the quantitative determination of THCA concentration. To do this, the team performed HCLA analysis of the samples, which generated percentage quantification of THCA in all three samples that could be directly assigned to the intensity of the peak for THCA. As such, the intensity of 1623 cm−1 band is directly proportional to the THCA content in the analyzed plant material.
The team noted that the carboxylated form of THC is THCA; thermal heating can induce conversion from THCA to THC. A band corresponding to the carboxyl group of THCA can distinguish this from THC. In addition, the other structural bands present in THC are also in common with THCA; since the teams’ analysis was based on a band at a frequency common to both the team can speculate that RS enables the quantification of THC in a sample without oxidation of THCA to THC.
The team concludes that their method offers an advantageous means of cannabis and hemp differentiation with the added benefit of THCA quantification. In particular, its portability makes it an essential tool for police and border control officials.
Acknowledgments
This study was supported by funds from Texas A&M AgriLife Research.
Source
Sanchez, L et al. (2020) Confirmatory non-invasive and non-destructive differentiation between hemp and cannabis using a hand-held Raman spectrometer. RSC Adv. DOI: 10.1039/C9RA08225E (Paper)
Further Reading